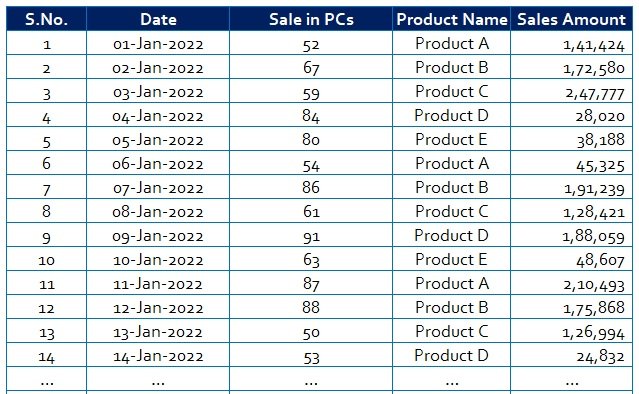
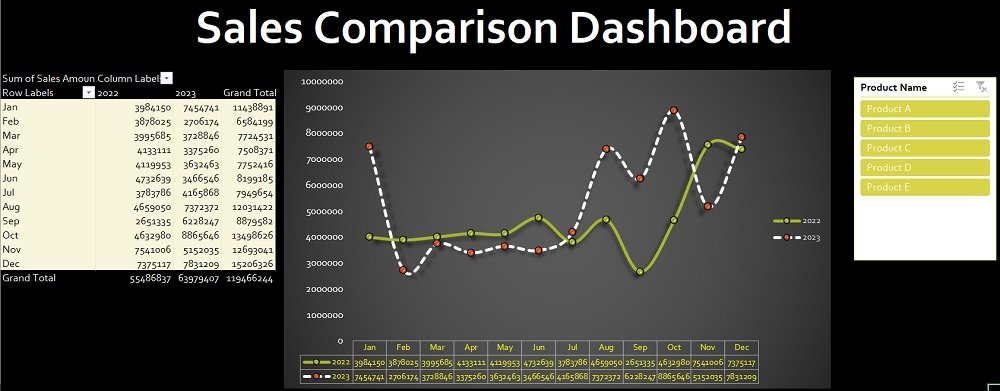
Here i will explain to you how can you make an Attractive Sales Comparison Dashboard in Excel. Here we are comparing 2 Years of sales Data which is given in an Excel sheet. The date of Sale is given, Product Name, Number of Pieces, and the Sales amounts are given in this sheet.
To make this Dashboard I will use the Pivot Table, Line Chart & Slicer Function.
Watch the below video to learn the step-by-step process and download the practice file at the bottom.
Sample of Sales Data
Final Dashboard
Tutorial Video
Thanks
Welcome Dear